

The Definitive Guide to Western Blotting: Workflow, Troubleshooting and Optimisation
A fully referenced, step-by-step guide to the immunoblotting workflow, from lysate preparation to quantitative imaging. Every stage includes the underlying science, the most common failure modes and the Geneflow products that solve them.
In this guide
- How Western blotting works and why it fails
- Step 0: Sample preparation
- Step 1: Protein separation by SDS-PAGE
- Hand-casting gels: the process in detail
- Step 2: Transfer (electroblotting)
- Step 3: Blocking and antibody incubation
- Step 4: Chemiluminescent detection and imaging
- Step 5: Quantification and loading controls
- Troubleshooting guide: 14 common problems
- The validation run: a protocol for new antibodies
- Product directory
- References

Western blotting was described independently by Towbin and colleagues1 and by Burnette2 at the end of the 1970s, building on Laemmli’s SDS-PAGE system3. The principle has barely changed since: proteins are separated by size in a polyacrylamide gel, moved electrophoretically onto a membrane, and then probed with an antibody that recognises the target. An enzyme-linked secondary antibody converts a chemiluminescent substrate into light, which is captured by film or a CCD camera.
What has changed is our understanding of how easily the method produces misleading data. Reviews of the technique consistently highlight the same weak points: uneven loading, saturated signals, inappropriate blocking, poorly validated antibodies and normalisation to housekeeping proteins that are not actually constant9,12,13,14. A blot is a chain of five or six sequential steps, and an error at any link is carried through to the final image, where it is often misread as a biological result.
This guide walks through each link in that chain. For each one we cover the underlying mechanism, the parameters that matter most, and the products in the Geneflow range that remove the most common sources of variability.
Everything downstream depends on the lysate. A degraded, under-extracted or unequally loaded sample cannot be rescued by a better antibody or a brighter substrate. Sample handling is the step most frequently skipped in troubleshooting, and it is the first place to look when band patterns are inconsistent between replicates5,19.
Lysis buffer selection
Choose the buffer for the compartment your target lives in. RIPA buffer (containing SDS, deoxycholate and NP-40 or Triton X-100) gives efficient whole-cell extraction including nuclear and membrane proteins, but its ionic detergents disrupt protein complexes. If you intend to co-immunoprecipitate or preserve native interactions, use a milder non-ionic buffer (NP-40 or Triton X-100 alone). Membrane-bound and cytoskeletal proteins often need sonication or a brief heat step to solubilise fully.
Protease and phosphatase inhibitors
Lysis releases proteases and phosphatases from their compartments. Add a broad-spectrum protease inhibitor cocktail to ice-cold buffer immediately before use, and include phosphatase inhibitors (sodium fluoride, sodium orthovanadate, beta-glycerophosphate) whenever a phospho-epitope is the target. Work on ice throughout and process samples promptly; a lysate left at room temperature for an hour can lose a phospho-signal entirely.
Quantification: never load by eye
Measure total protein with a Bradford7 or BCA8 assay and load equal masses in every lane. The two assays have different detergent tolerances: Bradford is disrupted by SDS above about 0.1%, whereas BCA copes with detergents but is sensitive to reducing agents. Match the assay to your lysis buffer. For most targets 10 to 30 µg of whole-cell lysate per lane is a sensible starting point9; more is not always better, because overloading distorts bands and pushes abundant proteins outside the linear range of detection.
Denaturation and reduction
Mix lysate with Laemmli sample buffer containing SDS and a reducing agent (DTT or beta-mercaptoethanol) and heat at 95 °C for 5 minutes. Two caveats: multi-pass membrane proteins frequently aggregate at 95 °C and should be heated at 37 °C for 30 minutes or 70 °C for 10 minutes instead; and if you intend to detect a target that depends on disulphide-stabilised conformation, run a non-reducing lane alongside. Geneflow supplies ready-made Protein Loading Buffer (2X Blue and 5X) so that the reducing agent concentration is consistent from batch to batch.
SDS coats denatured proteins with a roughly uniform negative charge (about 1.4 g SDS per gram of protein), so that migration through the gel depends almost entirely on molecular mass3,20. The discontinuous Laemmli system uses a low-percentage stacking gel at pH 6.8 to concentrate the sample into a tight band before it enters the resolving gel at pH 8.8.
Choosing the gel percentage
The acrylamide percentage sets the pore size and therefore the resolving window. As a working guide:
| Gel | Best resolution range | Typical use |
|---|---|---|
| 8% | 40 to 200 kDa | Large proteins, kinases, receptors |
| 10% | 25 to 150 kDa | General purpose |
| 12% | 15 to 100 kDa | Most cytosolic targets |
| 15% | 6 to 60 kDa | Small proteins, histones, cytokines |
| 4 to 12% gradient | 15 to 250 kDa | Multiple targets on one blot |
| 4 to 20% gradient | 6 to 300 kDa | Widest single-gel range |
Gradient gels sharpen bands because each protein slows as it enters progressively smaller pores, and they let you image a 20 kDa loading control and a 180 kDa target on the same membrane. FastGene Precast Protein Gels are available in 12%, 4 to 12%, 4 to 20% and 8 to 16% formats. They are cast at neutral pH in a Bis-Tris buffer system, which limits polyacrylamide hydrolysis and gives a 12-month shelf life, and their wedge-shaped wells hold up to 60 µL. They run in MOPS buffer and fit the FastGene PAGE system as well as Bio-Rad Mini-PROTEAN and Hoefer Mighty Small tanks.
Loading and running
- Include a pre-stained ladder in every gel. The BLUeye Pre-Stained Protein Ladder (10 to 245 kDa) has twelve bands with a red 75 kDa and green 25 kDa reference, so orientation and transfer can be checked at a glance. The BlueEasy ladder (6.5 to 270 kDa) extends the range for very small targets.
- Load the same volume in every lane, topping up with sample buffer where needed, so that lanes run at the same rate.
- Run at constant voltage (typically 100 to 150 V for a mini gel). Running too hot causes the outer lanes to lag behind the centre, producing the classic “smile”5. If you must run fast, use a cooling pack or run in a cold room.
- Use a running buffer made from a reliable stock. Geneflow’s 10X SDS-PAGE Tank Buffer (Tris-Glycine-SDS) removes a frequent source of batch variation.
For the tank itself, the FastGene PAGE Protein System was benchmarked directly against the Bio-Rad Mini-PROTEAN Tetra and accepts both FastGene and Bio-Rad precast gels. It casts leak-free and the inner chamber is easier to handle, which matters more than it sounds when you are loading twelve wells with a 10 µL tip.
Casting your own gels rather than buying them ready-made? The next section covers the polymerisation chemistry, a step-by-step casting protocol and the National Diagnostics acrylamide range in full.

Precast gels remove a whole class of variability, but hand-casting is still the right choice when you need a specific percentage, an unusual cross-linker ratio, a thicker gel for preparative loads, or simply a lower cost per gel in a high-throughput lab. Done properly it is entirely reproducible. Done carelessly it is the single largest source of the artefacts described later in this guide. The difference is almost always reagent quality and attention to the polymerisation chemistry.
The chemistry you are controlling
A polyacrylamide gel is a free-radical vinyl polymerisation. Ammonium persulphate (APS) decomposes in water to give sulphate free radicals; TEMED, a tertiary amine, catalyses that decomposition and propagates the radical chain23,28. Acrylamide monomers add to the growing chain, and bis-acrylamide (N,N’-methylenebisacrylamide), carrying two vinyl groups, ties adjacent chains together into a three-dimensional mesh. Two numbers define the resulting matrix. Total monomer concentration (%T) sets the average pore size and therefore the sieving range. The acrylamide-to-bis ratio (%C) sets how tightly cross-linked that mesh is: 37.5:1 is standard for SDS-PAGE of proteins, 29:1 gives a slightly more open matrix, and 19:1 produces the fine, high-resolution pores wanted for peptides, nucleic acids and sequencing gels25,26.
The discontinuous Laemmli system3, built on the disc electrophoresis work of Ornstein and Davis23,24, requires two separate gels poured in sequence. The resolving gel is cast at pH 8.8 in 0.375 M Tris-HCl with 0.1% SDS; the stacking gel is cast on top of it at pH 6.8 in 0.125 M Tris-HCl. That pH step is what creates the moving boundary between leading chloride and trailing glycine ions, compressing a 30 µL sample into a band a few hundred micrometres deep before it ever reaches the resolving gel. Get the stacking gel pH wrong and you lose the stacking effect entirely, which shows up as broad, smeared bands that are easily misread as a transfer or antibody problem.
Why monomer purity matters more than people expect
Acrylamide in solution hydrolyses slowly to acrylic acid. Once incorporated into the gel, those carboxyl groups act as fixed negative charges in the matrix, generating electroosmotic flow and the classic vertical streaking that no amount of protocol tweaking will fix. Stored acrylamide also accumulates aldehyde oxidation products, which react with proteins, alter their structure and shift their Rf values, so the same sample no longer runs at the same apparent mass between batches. Righetti and colleagues showed that polymerisation efficiency itself is strongly pH-dependent and that a significant fraction of monomer can remain unreacted under suboptimal conditions26,27, and unpolymerised acrylamide readily forms covalent adducts with free cysteine residues. This is precisely why a deionised, filtered, nitrogen-packed solution outperforms weighing out powder, quite apart from the safety argument.
Casting, step by step
- Assemble and leak-test the cassette. Clean the plates with ethanol and lint-free tissue; any grease leaves a band-distorting defect. Fill with water, stand for five minutes, and check the level has not dropped before you mix anything.
- Mix the resolving gel. Combine acrylamide solution, resolving buffer and water to your target %T. Degassing under vacuum for 10 to 15 minutes helps, since dissolved oxygen is a radical scavenger that inhibits polymerisation and is a common reason for a soft, sticky gel surface.
- Add APS then TEMED last, in that order, and swirl gently without introducing bubbles. Typical final concentrations are 0.05 to 0.1% APS and 0.05 to 0.1% TEMED. Polymerisation starts immediately, so pour within a minute or two.
- Overlay the resolving gel. Water-saturated butanol, or simply water, excludes oxygen and gives a flat, sharp interface. Without an overlay you get a curved, oxygen-inhibited meniscus and uneven band fronts.
- Wait for full polymerisation, typically 30 to 45 minutes at room temperature. Keep a little of the mix in the tube to check polymerisation; when that has set firmly, the gel has too. Rinse off the overlay thoroughly before proceeding.
- Cast the stacking gel at 4 to 5%T, insert the comb at an angle to avoid trapping air under the teeth, and leave for a further 30 minutes.
- Use it promptly or store it correctly. Hand-cast Tris-glycine gels are best used the same day; wrapped in damp tissue and sealed, they keep for a few days at 4 °C, but continued hydrolysis at pH 8.8 progressively degrades the matrix.
Tuning the polymerisation
Aim for 20 to 30 minutes to set. Faster is not better: rapid polymerisation produces short, heterogeneous chains and a mechanically weaker, less uniform matrix. If the gel sets in under 10 minutes, halve the APS and TEMED. If it will not set at all, suspect the APS first, since the aqueous stock loses activity within a week or two and absorbed atmospheric water degrades the solid. Make it fresh weekly and keep it at 4 °C. Low-percentage gels (below 8%T) polymerise more slowly and benefit from slightly more catalyst; high-percentage gels need less. Working in a cold room roughly doubles the set time.
The National Diagnostics range from Geneflow
National Diagnostics manufacture what is, in our view, the best-controlled set of electrophoresis monomers available. Every solution is deionised, 0.2 micron filtered, made with 18 megohm water and stabilised for a long shelf life; the acrylamide grades are certified aldehyde-free and acrylic acid-free, which is the specification that directly prevents streaking and Rf drift.
- For standard SDS-PAGE (37.5:1): ProtoGel 30% or the more concentrated ProtoGel 40%, which leaves more room in the recipe for buffer and additives. Pair them with ProtoGel Resolving Buffer and ProtoGel Stacking Buffer so that the critical pH step is fixed rather than re-created by hand each time.
- For finer or more open matrices: AccuGel 19:1 for peptides, SSCP and nucleic acid work, and AccuGel 29:1 for native PAGE and general-purpose gels. Both are certified RNase and DNase free.
- For full control of %C: AcrylaGel with Bis-AcrylaGel lets you dial in any cross-linker ratio you like, which matters for gradient gels and for unusual separations where neither 37.5:1 nor 29:1 quite works.
- Initiator and catalyst: Ammonium Persulfate (Ultra Pure) exceeds ACS standards and has low absorbed water, so initiation is consistent batch to batch, and TEMED (Ultra Pure) is fractionally distilled to remove trace metals and amine impurities and stored under nitrogen. These two reagents are where most polymerisation failures originate, and they are also the cheapest part of the recipe to get right.
- For denaturing and sequencing gels: the UreaGel 6 and UreaGel 8 ready-to-cast systems carry the TBE and 7.5 M urea at working strength already, so only APS and TEMED are added. The SequaGel XR concentrate covers extended-range separations.
- Before the gel, for awkward samples: the ProtoGel Sample Prep Kit precipitates protein away from high salt and other interfering substances. Salt in the sample is a frequent and under-diagnosed cause of smiling gels and blurred bands, and no amount of care in casting will compensate for it.
If hand-casting is costing you more time than it saves, it is worth comparing against FastGene Precast Protein Gels, which have a 12-month shelf life and a Bis-Tris chemistry that sidesteps the hydrolysis problem altogether. Many labs keep both: precast gels for routine blots, ProtoGel and AccuGel for the percentages and formats nobody supplies ready-made.
Transfer moves proteins from the fragile gel onto a membrane that can survive hours of antibody incubation and washing. Towbin’s original tank (wet) transfer1 and Kyhse-Andersen’s semi-dry method4 are both still in daily use, and each has a place.
Membrane choice
Nitrocellulose binds proteins by hydrophobic and electrostatic interaction, needs no pre-wetting in methanol, and gives lower background with most chemiluminescent substrates. PVDF has roughly double the binding capacity, is mechanically tougher and can be stripped and re-probed several times, but it must be activated in methanol and tends to give higher background. Pore size matters as much as material: 0.45 µm is standard, whereas proteins below about 20 kDa can pass straight through and need a 0.2 µm membrane. Geneflow supplies Nitrocellulose rolls in both 0.45 µm and 0.2 µm (30 cm x 3 m), which work out considerably cheaper per blot than pre-cut sheets.
Wet versus semi-dry
Wet transfer in a Tris-glycine-methanol buffer is the reference method for quantitative work and for proteins above about 100 kDa, because the large buffer reservoir keeps pH and temperature stable over long runs19,22. Semi-dry transfer takes 15 to 45 minutes and uses very little buffer, but its limited buffering capacity makes it less reliable for large proteins and for overnight runs. For FastGene precast gels, Nippon Genetics specifically recommend wet transfer, with 10% methanol in the transfer buffer rising to 20% for small proteins.
Methanol strips SDS from proteins and improves binding to the membrane, but it also shrinks the gel and slows the elution of large proteins. If a target above 150 kDa transfers poorly, reduce methanol to 10% and add 0.01 to 0.05% SDS to the buffer22. Geneflow’s 10X Tris-Glycine Electroblotting Buffer provides a consistent base to which methanol is added fresh.
Assembling the sandwich
Assemble the cassette from the cathode (black) to the anode (red). Proteins carry a negative charge and move towards the anode, so the membrane must sit on the anode side of the gel:
- Sponge (cathode side)
- Filter paper
- Gel
- Membrane
- Filter paper
- Sponge (anode side)
Pre-soak everything in transfer buffer, and roll out air bubbles between the gel and membrane with a pipette or roller. A trapped bubble blocks current locally and leaves a blank patch on the blot. The BLUeye ladder is your first check: if its bands are visible on the membrane and absent from the gel, the transfer has worked.
Confirming transfer
Stain the membrane with Ponceau S before blocking. It is reversible, takes five minutes, and reveals uneven loading or bubbles before you have committed any antibody16,17. Staining the post-transfer gel is equally informative: residual protein means transfer was incomplete. FastGene Q-Stain shows bands in under 10 minutes without fixation or destaining, so this check costs almost nothing.
Transfer equipment from Geneflow:
- FastGene Western Blot Complete System: tank, wet-blotting insert and accessories in one package, or the upgrade set to add blotting to an existing FastGene PAGE tank.
- OmniBlot and Electro Blot Mini, high-intensity wet blotters for mini and multi-gel formats.
- Semi Dry Mini Blotter (10 x 10 cm) and Semi Dry Maxi Blotter (20 x 20 cm) for rapid transfers of mid-sized proteins.

Why blocking matters
The membrane binds any protein it meets, including your antibodies. Blocking saturates the unoccupied surface with an inert protein so that antibody binding is limited to the target. Non-fat dry milk was introduced for this purpose in 198418 and remains the cheapest effective blocker. BSA is the usual alternative. Blocking for 1 hour at room temperature or overnight at 4 °C in 5% blocker in TBST is standard practice5,6.
Two Geneflow products address the limitations of home-made blockers.
ProtoBlock is a ready-made solution of proteins, protein analogues and detergents formulated to minimise endogenous background across Western, Southern and immunoassay applications.
FastGene Block & Go takes a different approach: it is a protein-free blocker and signal enhancer that lets you combine blocking, primary and secondary antibody incubation into a single one-hour step, with a reported 2 to 5-fold signal increase for most targets. Because it contains no milk or BSA it is compatible with phospho-antibodies and biotin systems.
Primary antibody
Antibody quality is the single largest source of irreproducibility in Western blotting. Uhlen and colleagues proposed five validation pillars, including genetic knockout, orthogonal methods and independent antibodies15; at minimum, check that your antibody has been validated in Western blot specifically, in your species, and ideally with a knockout or knockdown control. Dilute in blocking buffer (or in TBST with 1% blocker if background is an issue), starting from the manufacturer’s recommendation and titrating from there. Overnight at 4 °C with gentle agitation gives better signal-to-noise than one hour at room temperature for most antibodies9.
Secondary antibody and washing
HRP-conjugated secondaries are typically used at 1:5,000 to 1:20,000. Over-concentrated secondary is the most common cause of uniform high background, and with high-sensitivity substrates such as WESTAR Supernova, dilutions of 1:50,000 or higher are often appropriate. Wash three times for 5 to 10 minutes in TBST between every step, with enough buffer to submerge the membrane fully. Sodium azide in antibody stocks irreversibly inhibits HRP, so never use azide-preserved secondaries with a chemiluminescent workflow.

Enhanced chemiluminescence (ECL) relies on HRP oxidising luminol in the presence of peroxide and an enhancer, emitting light at around 425 nm. Substrates differ mainly in their enhancer chemistry, which sets both peak intensity and how long the signal persists. Matching the substrate to the abundance of your target is more important than most people realise: a substrate that is too bright saturates strong bands and destroys the linear range you need for quantification, while one that is too weak gives you nothing at all.
Matching substrate to target abundance
| Substrate | Detection level | Signal duration | Use it when |
|---|---|---|---|
| WESTAR Sun | Mid-picogram | Stable, standard | Abundant targets, routine blots, direct swap for standard ECL |
| FastGene Western ECL Kit | High femtogram to low picogram | Long | General purpose, film or CCD |
| WESTAR Antares | Mid-femtogram | Extended (working solution stable 3 days) | Many blots per session, multiple exposures, wide dynamic range |
| WESTAR Supernova | Low femtogram | Around 11 hours | Low-abundance targets, scarce samples, very high antibody dilutions |
| WESTAR Hypernova | Trace (brightest available) | High output | Targets invisible with any other substrate |
Customer comparison data across the WESTAR range is published in our guide to WESTAR ECL substrates; in one serial dilution series Sun resolved recombinant protein to 1.6 ng with zero background, while Supernova continued to detect down to 64 pg.
Substrate exhaustion and white bands
If an intense band appears as a white or hollow region surrounded by a dark halo, the HRP in that band has consumed all the local substrate before the image was captured. This is not a weak signal; it is an over-strong one. Dilute the secondary further, load less protein, or step down to a less sensitive substrate. Conversely, a signal that fades within a minute or two usually means a substrate with too short a half-life for your imaging set-up; Antares or Supernova solve this.
Film versus CCD imaging
X-ray film has a linear response over only about one order of magnitude and saturates easily, which makes it poorly suited to quantification9,10. Cooled CCD imagers capture 16-bit data with a dynamic range of four orders of magnitude or more, allow multiple exposures of the same blot without handling it, and can automatically calculate exposure to avoid saturation. Syngene’s G:BOX Chemi XRQ, XX6 and XX9 systems, and the compact GeneGnome XRQ built specifically for chemiluminescence, are covered in our Syngene imaging guide. The XRQ offers a 4.8 OD dynamic range, and the modular HILED design allows an upgrade path to multiplex fluorescence later.
Whatever the imager, always check the saturation indicator before saving. A saturated band cannot be quantified, and many software packages will not warn you.
A Western blot is semi-quantitative at best, and only within a defined linear range. Taylor and Posch set out the requirements for a quantitative experiment9,10: establish the linear range of detection for both target and loading control by running a dilution series of your lysate, keep every sample inside that range, and normalise against something that is genuinely proportional to the amount of protein loaded.
The problem with housekeeping proteins
Beta-actin, GAPDH and tubulin are abundant, which means they saturate at loads where your target is still in the linear range, so the ratio becomes meaningless11,12. Their expression also changes with cell density, differentiation state, hypoxia and many treatments. Gilda and Gomes showed that total protein staining outperformed beta-actin as a loading control11, and Eaton and colleagues reached the same conclusion for fluorescent Westerns21. Journals increasingly require total protein normalisation, and Ponceau S on the membrane17 or a post-transfer Q-Stain of the gel are both acceptable, low-cost ways to achieve it.
The ten most common housekeeping proteins
No housekeeping protein is genuinely constant. Each one sits in a particular compartment doing a particular job, and anything that perturbs that job perturbs the control. The table below lists the ten used most often, ordered by molecular weight, so you can pick one that resolves clearly away from your target and check whether your treatment is likely to move it.
| Protein (gene) | Observed MW | Role in the cell | What changes its expression |
|---|---|---|---|
| Histone H3 (H3-3A / H3C1) | 15 to 17 kDa | Core nucleosome protein; packages DNA into chromatin and carries the post-translational marks that regulate transcription. | Total H3 is very stable, which is why it is the standard control for nuclear and acid-extracted histone fractions. It is cleaved during apoptosis, and histone synthesis is coupled to S phase, so heavily synchronised cultures can shift. Never use it for whole-cell lysates, where the nuclear fraction varies with lysis efficiency. |
| COX IV (COX4I1) | 17 kDa | Nuclear-encoded subunit of cytochrome c oxidase, complex IV of the mitochondrial respiratory chain. | Tracks mitochondrial mass, so it moves with anything that drives mitochondrial biogenesis or turnover: PGC-1α signalling, exercise or contractile activity, differentiation, hypoxia, nutrient stress and mitophagy. Use it as a mitochondrial fraction marker rather than a global loading control. |
| Cyclophilin B (PPIB) | 21 kDa | ER-resident peptidyl-prolyl isomerase; accelerates protein folding and assists collagen maturation. | Useful for low molecular weight targets where actin and tubulin are too far up the gel. Induced by ER stress and the unfolded protein response, and altered in secretory cell types under heavy synthetic load, so avoid it in tunicamycin, thapsigargin or hypoxia experiments. |
| VDAC1 / Porin (VDAC1) | 31 to 32 kDa | Voltage-dependent anion channel in the outer mitochondrial membrane; carries metabolites between cytosol and mitochondrion. | Like COX IV, it reports mitochondrial content rather than total protein. Changes with mitochondrial biogenesis, apoptotic signalling and metabolic reprogramming, and is frequently upregulated in tumour cells. Best reserved for confirming equal loading of mitochondrial preparations. |
| GAPDH (GAPDH) | 36 to 37 kDa | Glycolytic enzyme catalysing the conversion of glyceraldehyde-3-phosphate; also has moonlighting roles in transcription, membrane trafficking and apoptosis. | The most widely used and one of the least reliable. Because it is a glycolytic enzyme it responds to hypoxia (a HIF-1 target), glucose concentration, insulin, proliferation rate, cell density and hypoxia-mimetic drugs, and is markedly upregulated in many tumours. Avoid it in any metabolic, hypoxia or cancer comparison. |
| TBP (TBP) | 38 kDa (runs 38 to 43) | TATA-binding protein; the general transcription factor that nucleates assembly of the RNA polymerase II pre-initiation complex. | A good nuclear loading control because it is far less abundant than actin or GAPDH and so stays inside the linear range at normal loads. It runs anomalously high for its predicted mass. Levels shift with global transcriptional activity and during differentiation. |
| Beta-actin (ACTB) | 42 kDa | Cytoskeletal microfilament protein; drives cell shape, adhesion, motility and cytokinesis. | Extremely abundant, so it saturates at loads where most targets are still linear. Expression changes with confluence, adhesion and substrate stiffness, serum stimulation, differentiation (particularly muscle, where isoform switching occurs), cytoskeletal drugs such as cytochalasin, and in many cancers. Anti-actin antibodies often cross-react with the gamma isoform. |
| Alpha-tubulin (TUBA1A) | 50 to 55 kDa | Forms the alpha/beta heterodimer that polymerises into microtubules, supporting intracellular transport and the mitotic spindle. | Tubulin autoregulates its own synthesis in response to free dimer concentration, so microtubule drugs (nocodazole, colchicine, taxol) change it directly. It also varies through the cell cycle, rising in mitosis, and during neuronal differentiation. Extensive post-translational modification can shift apparent mass. |
| Lamin B1 (LMNB1) | 66 to 68 kDa | Type V intermediate filament forming the nuclear lamina; maintains nuclear shape, anchors chromatin and organises replication. | A reliable nuclear fraction marker, but it declines sharply in senescent cells and with ageing, which makes it a poor control for senescence, DNA damage or replicative-exhaustion studies. It is also degraded during apoptosis and changes with differentiation state. |
| HSC70 (HSPA8) | 70 to 73 kDa | Constitutively expressed member of the HSP70 chaperone family; folds nascent polypeptides, disassembles clathrin coats and delivers substrates for chaperone-mediated autophagy. | Chosen deliberately over inducible HSP70 (HSPA1A), which rises many-fold on heat or proteotoxic stress and is therefore useless as a control. HSC70 is far steadier, but still increases modestly under sustained proteotoxic stress and during autophagy induction. Check the antibody discriminates HSPA8 from HSPA1A. |
| Vinculin (VCL) | 117 to 124 kDa | Focal adhesion and adherens junction protein; links integrin and cadherin complexes to the actin cytoskeleton and transmits mechanical force. | The usual choice for high molecular weight targets, where a 42 kDa control is too far down the blot to reflect transfer of a large protein. Being mechanosensitive, it responds to substrate stiffness, adhesion state, plating density and epithelial-to-mesenchymal transition, and is often reduced in metastatic lines. |
Choosing one that will not mislead you
- Match the molecular weight to your target. A control should sit close enough to your target to report the same transfer conditions, but far enough away that the bands resolve cleanly. Vinculin for large targets, cyclophilin B for small ones, actin or GAPDH only for the middle of the range.
- Match the compartment. Lamin B1, TBP and histone H3 report nuclear loading; COX IV and VDAC1 report mitochondrial loading; cyclophilin B reports the ER. Using a nuclear control on a whole-cell lysate measures fractionation efficiency, not loading.
- Check it against your treatment before you trust it. Run the control on a pilot blot across your full treatment range. If it moves, it is a variable in your experiment, not a constant.
- Confirm it is in the linear range at your load. Actin and GAPDH are abundant enough to saturate at 20 to 30 µg of lysate while the target is still linear, which makes the ratio meaningless11,12.
- Where the data are quantitative, prefer total protein normalisation. A Ponceau or FastGene Q-Stain image of the whole lane avoids every problem in the table above and is increasingly what reviewers expect11,14,21.
Practical rules for quantitative blots
- Run a 5-point dilution series of a pooled sample on the first gel to define the linear range for each antibody10,14.
- Use technical replicates on the same gel and biological replicates across gels; account for gel-to-gel variation with an internal reference sample loaded on every gel13.
- Capture 16-bit images and quantify from the raw data, not from a contrast-adjusted export.
- Subtract local background rather than a global value; uneven blocking produces regional background differences.
- Report the normalisation method, substrate, exposure and imaging system in the methods section. Reviewers now expect this12,14.
The three problems below account for the majority of support enquiries we receive. A full reference table covering fourteen failure modes follows.
Problem 1: Weak or no signal

Work backwards through the chain. First confirm the target was ever on the membrane: check the ladder transferred, Ponceau-stain the membrane and Q-Stain the post-transfer gel. If protein is present, the fault lies with the antibody, the HRP or the substrate.
- Transfer: for small proteins switch to 0.2 µm nitrocellulose; for large proteins lengthen the wet transfer, reduce methanol and add 0.01% SDS22.
- Antibody: increase primary concentration or incubate overnight at 4 °C; confirm the antibody is validated for Western blot in your species15.
- HRP inactivation: check for sodium azide in any buffer or antibody stock.
- Substrate: move up a tier. If FastGene ECL or WESTAR Sun show nothing, WESTAR Supernova detects into the low femtogram range. Block & Go adds a further 2 to 5-fold enhancement.
Problem 2: High background
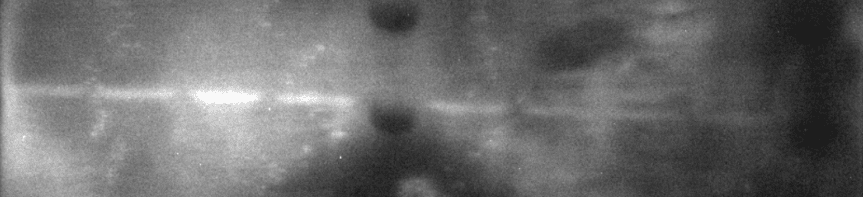
Uniform grey background points to insufficient blocking, too much secondary antibody, inadequate washing or a substrate that is too sensitive for the antibody concentration in use. Patchy or blotchy background usually means the membrane dried out at some point, or that blocker was not fully dissolved.
- Block for longer (overnight at 4 °C) or switch to ProtoBlock; for phospho-targets, abandon milk5.
- Dilute the secondary antibody 2 to 5-fold and add 0.05 to 0.1% Tween-20 to washes; increase wash number and volume.
- Keep the membrane submerged at every stage. A dried membrane cannot be rescued.
- Overexposure creates apparent background. A CCD imager that auto-calculates exposure, such as the Syngene G:BOX range, removes the guesswork.
Problem 3: Band at the wrong molecular weight
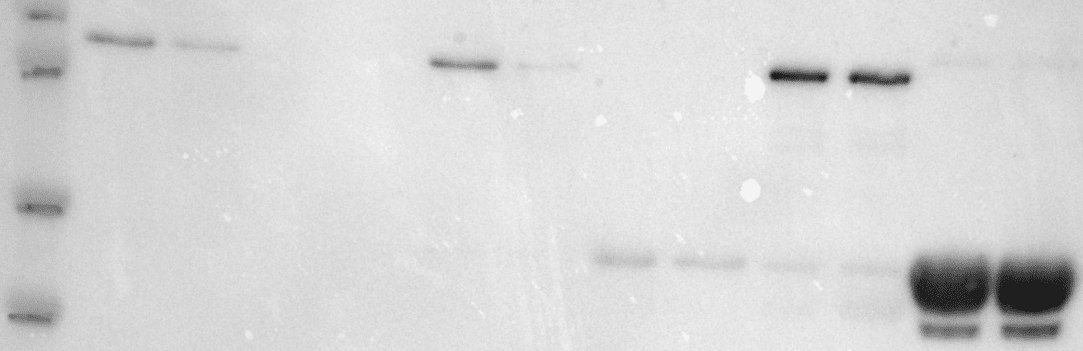
Before assuming the antibody is wrong, remember that apparent mass on SDS-PAGE is an estimate20. Glycosylation, phosphorylation and ubiquitylation increase apparent mass; proteolysis, alternative splicing and signal-peptide cleavage reduce it. Highly charged or very hydrophobic proteins also migrate anomalously. Compare the observed size to the literature for your cell type and check for isoforms in UniProt.
- Use a well-characterised ladder such as BLUeye and note that pre-stained ladders are themselves approximate: the dye adds mass and the band positions vary slightly between gel chemistries.
- Bis-Tris/MOPS gels and Tris-glycine gels give slightly different migration for the same protein; be consistent within a study.
- If a lower band appears alongside the expected one, suspect degradation and revisit inhibitor use and sample storage.
Full troubleshooting table
| Symptom | Most likely causes | What to change | Geneflow solution |
|---|---|---|---|
| No bands at all, including ladder | Sandwich assembled the wrong way round; no current; membrane on wrong side of gel | Check cassette orientation (membrane towards anode); check the power supply reads current | BLUeye ladder as visual transfer check |
| Ladder transferred, target absent | Target not expressed; antibody unsuitable; HRP inhibited by azide; substrate not sensitive enough | Run a positive control lysate; increase primary; remove azide; move up a substrate tier | WESTAR Supernova or Hypernova; Block & Go for signal enhancement |
| Small protein (below 20 kDa) missing | Passed through 0.45 µm membrane; ran off the gel; poor retention on membrane | Use 0.2 µm membrane; 15% or 4 to 20% gel; shorter transfer; 20% methanol | 0.2 µm Nitrocellulose Roll; FastGene 4 to 20% precast gel; BlueEasy ladder (6.5 kDa) |
| Large protein (above 150 kDa) missing | Incomplete elution from gel; too much methanol; semi-dry transfer too short | Wet transfer overnight at 4 °C; 10% methanol plus 0.01% SDS; 8% or gradient gel22 | Electro Blot Mini high-intensity wet blotter; Tris-Glycine Electroblotting Buffer |
| Uniform high background | Under-blocking; secondary too concentrated; insufficient washing; overexposure | Block longer; dilute secondary; add Tween-20; more washes; auto-exposure | ProtoBlock; Syngene G:BOX auto-exposure |
| Patchy or blotchy background | Membrane dried; undissolved blocker; contaminated buffers; uneven substrate coverage | Keep membrane wet; filter blocker; fresh buffers; use enough substrate to cover the whole membrane | Ready-made ProtoBlock avoids undissolved milk powder |
| Speckled or dotted background | Aggregated secondary antibody; bacterial growth in buffers; particulates in blocker | Centrifuge antibody before use; make fresh TBST; filter blocking solution | Fresh 10X buffer stocks from Geneflow |
| Multiple non-specific bands | Primary too concentrated; cross-reactive antibody; proteolysis; too much lysate | Titrate primary down; add inhibitors; load 10 to 20 µg; test a second antibody15 | Higher dilutions become possible with WESTAR Supernova |
| White or hollow bands with dark halo | Substrate exhausted by excess HRP | Dilute secondary; load less; use a less sensitive substrate; image sooner | Step down to WESTAR Sun or FastGene ECL |
| Smiling bands | Gel ran too hot; uneven heat across gel | Lower voltage; cooling pack; cold room; consistent buffer5 | Bis-Tris FastGene precast gels resist smiling; FastGene PAGE system |
| Smeared or streaked lanes | Overloading; sample not fully denatured; salt or DNA in lysate; old acrylamide | Load less; heat correctly; shear DNA by sonication; use fresh, deionised acrylamide | ProtoGel (nitrogen-packed); FastGene precast gels |
| Bands in wrong lane order or mirror image | Membrane flipped during handling | Cut one corner of the membrane before transfer; use an asymmetric ladder | BLUeye’s red 75 kDa and green 25 kDa bands give instant orientation |
| Signal fades before imaging | Short-lived substrate; HRP exhausted; imaging delayed | Choose a substrate with extended signal duration; image within 5 minutes of substrate addition | WESTAR Antares (extended signal) or Supernova (11 hours) |
| Results not reproducible between gels | Variable loading; different exposure; housekeeping control saturated; hand-cast gel variability | Quantify protein; total protein normalisation; define linear range; internal reference sample9,10,11,13 | FastGene precast gels; Q-Stain for total protein; 16-bit CCD imaging |
When you open a new antibody or start on a low-abundance target, run one deliberately generous blot first. The aim is to establish that the reagents work at all before you start economising. Once you have a signal, titrate each parameter down in subsequent runs until you reach the point where signal-to-noise is best and reagent use is lowest.
- Load a dilution series. 5, 10, 20, 30 and 40 µg of a pooled lysate in adjacent lanes, plus a positive control if one exists. This gives you the linear range on the very first gel10,14.
- Use a gradient gel. A 4 to 20% FastGene precast gel means you will see the target wherever it runs, and the loading control on the same membrane.
- Transfer wet, cold and slow. Overnight at 4 °C at 30 V maximises transfer across all sizes (Reduce this to 4 °C at 100V for one hour before moving attempting rapid transfer methods). Confirm with the BLUeye ladder and a Ponceau stain, and Q-Stain the gel afterwards.
- Block generously. Overnight at 4 °C, in the blocker appropriate to the target (no milk for phospho-epitopes). ProtoBlock or Block & Go both work well here.
- Start the primary at the top of the manufacturer’s range, overnight at 4 °C. Titrate down over the next two or three runs.
- Have two substrates on the bench. Develop with WESTAR Sun or FastGene ECL first. If nothing appears, wash briefly and re-develop with WESTAR Supernova before declaring the experiment a failure. The two substrates together cover four orders of magnitude of target abundance.
- Image on a CCD with auto-exposure and save the raw 16-bit file. Take a second, longer exposure for weak bands and a shorter one for strong bands; never rely on a single capture.
Every product referenced in this guide, grouped by workflow stage. Catalogue numbers are given for ordering; contact sales@geneflow.co.uk or call 01543 414704 for institutional pricing and sample requests.
| Stage | Product | Cat. No. | Why it matters |
|---|---|---|---|
| Sample prep | Protein Loading Buffer Blue (2X), 10 x 1 ml | B9-0040 | Consistent SDS and reducing agent, batch to batch |
| Protein Loading Buffer (5X), 10 x 1 ml | B9-0042 | Concentrated format for dilute lysates | |
| Separation | FastGene Precast Protein Gel 12%, pk 10 | A2-0404 | 15 to 100 kDa; 12-month shelf life; 60 µL wells |
| FastGene Precast Protein Gel 4 to 12%, pk 10 | A2-0406 | Broad range gradient for multi-target blots | |
| FastGene Precast Protein Gel 4 to 20%, pk 10 | A2-0408 | Widest range; ideal for validation runs | |
| FastGene Precast Protein Gel 8 to 16%, pk 10 | A2-0410 | Mid-range gradient with tighter resolution | |
| MOPS Buffer Sachets, pk 10 | B9-0102 | Required running buffer for FastGene Bis-Tris gels | |
| SDS-PAGE Tank Buffer 10X, 1 L / 4 L | B9-0034 / B9-0032 | Reproducible Tris-glycine-SDS running buffer | |
| Hand-casting | ProtoGel 30% (37.5:1), 450 ml / 1 L | A2-0074 / A2-0072 | Deionised, nitrogen-packed; zero acrylic acid, aldehyde free |
| ProtoGel 40% (37.5:1), 450 ml / 1 L | A2-0077 / A2-0075 | Higher concentration leaves more room for buffer and additives | |
| ProtoGel Resolving Buffer (Tris/SDS), 450 ml / 1 L | B9-0012 / B9-0010 | Fixed pH 8.8, 0.375 M Tris-HCl, 0.1% SDS | |
| ProtoGel Stacking Buffer (Tris/SDS), 200 ml | B9-0014 | Fixed pH 6.8; preserves the stacking effect | |
| AccuGel 19:1 (40%), 450 ml / 1 L | A2-0062 / A2-0060 | Fine pores for peptides, SSCP and nucleic acids | |
| AccuGel 29:1 (30% / 40%) | A2-0066, A2-0064 / A2-0070, A2-0068 | Slightly more open matrix; native PAGE and general use | |
| AcrylaGel (30% acrylamide), 450 ml / 1 L | A2-0086 / A2-0084 | Acrylamide alone, for full control of cross-linker ratio | |
| Bis-AcrylaGel (2% bis-acrylamide), 450 ml / 1 L | A2-0090 / A2-0088 | Pair with AcrylaGel to dial in any %C you need | |
| Ammonium Persulfate (Ultra Pure) | A2-0201 / A2-0200 | Exceeds ACS standards; low absorbed water for consistent initiation | |
| TEMED (Ultra Pure), 25 ml | A2-0104 | Fractionally distilled, trace-metal free, stored under nitrogen | |
| UreaGel 6 (6% working dilution, 19:1) | A2-0026 / A2-0024 | Denaturing gels; TBE and 7.5 M urea already at working strength | |
| UreaGel 8 (8% working dilution, 19:1) | A2-0030 / A2-0028 | As above at 8%T; add only APS and TEMED | |
| SequaGel XR (50% concentrate) | A2-0054 / A2-0052 | Extended-range separations for sequencing gels | |
| ProtoGel Sample Prep Kit | A2-0071 | Removes salt and interfering substances before loading | |
| Ladders | BLUeye Pre-Stained Protein Ladder, 10 to 245 kDa, 500 µL | S6-0024 | Twelve bands, tri-colour, approx. 250 loads |
| BlueEasy Pre-Stained Protein Ladder, 6.5 to 270 kDa, 500 µL | S6-0027 | Extended low-mass range | |
| Transfer | FastGene Western Blot Complete System | G9-2714 | Wet transfer, compatible with FastGene PAGE tank |
| FastGene PAGE Protein Complete System | G9-2700 | Leak-free casting and running; Mini-PROTEAN compatible | |
| Electro Blot Mini, 5-Position High Intensity System | G9-0414 | Fast, efficient wet transfer with cooling pack | |
| Semi Dry Mini Blotter / Maxi Blotter | B4-0030 / B4-0040 | Rapid transfer, minimal buffer | |
| Nitrocellulose Roll 0.45 µm / 0.2 µm, 30 cm x 3 m | B3-0010 / B3-0012 | Low-background membrane; 0.2 µm for small proteins | |
| Tris-Glycine Electroblotting Buffer 10X, 1 L / 4 L | B9-0058 / B9-0056 | Consistent transfer buffer base | |
| Total protein check | FastGene Q-Stain, 1 L | S6-0052 | 10-minute, methanol-free gel stain; 10 ng sensitivity |
| ProtoBlue Safe Colloidal Coomassie, 1 L / 4 L | S6-0044 / S6-0046 | Eco-friendly colloidal stain for archival gels | |
| Blocking | ProtoBlock Membrane Blocking Solution | B9-0060 | Ready-made, broad-spectrum blocker |
| FastGene Block & Go, 500 ml | K1-0165 | Protein-free; block plus both antibodies in one hour; 2 to 5-fold signal boost | |
| Detection | FastGene Western ECL Kit, 100 ml | K1-0164 | High femtogram to low picogram; long signal |
| WESTAR Sun HRP Detection Kit, 250 ml | K1-0052 | Mid-picogram; routine, abundant targets | |
| WESTAR Antares, 2 x 125 ml | K1-0096 | Mid-femtogram; extended signal, wide dynamic range | |
| WESTAR Supernova, 100 ml | K1-0068 | Low femtogram; 11-hour signal; high antibody dilutions | |
| WESTAR Hypernova, 2 x 10 ml / 2 x 50 ml | K1-0098 / K1-0099 | Brightest available; trace targets | |
| Imaging | G:BOX Chemi XRQ, XX6, XX9; GeneGnome XRQ | G5-0010, G5-0026, G5-0028 | Cooled 16-bit CCD; 4.8 OD dynamic range; auto-exposure; demo available |
Build a workflow that gives you the same answer each run
Reproducible Western blotting comes from removing variability one step at a time. Whether you need a substrate that finds a target you have never been able to see, a gel that runs the same way every week, or an imager that stops you guessing at exposure times, our technical team can put together a sample pack matched to your targets.
- Towbin H, Staehelin T, Gordon J. Electrophoretic transfer of proteins from polyacrylamide gels to nitrocellulose sheets: procedure and some applications. Proc Natl Acad Sci USA. 1979;76(9):4350-4354.
- Burnette WN. “Western blotting”: electrophoretic transfer of proteins from sodium dodecyl sulfate-polyacrylamide gels to unmodified nitrocellulose and radiographic detection with antibody and radioiodinated protein A. Anal Biochem. 1981;112(2):195-203.
- Laemmli UK. Cleavage of structural proteins during the assembly of the head of bacteriophage T4. Nature. 1970;227(5259):680-685.
- Kyhse-Andersen J. Electroblotting of multiple gels: a simple apparatus without buffer tank for rapid transfer of proteins from polyacrylamide to nitrocellulose. J Biochem Biophys Methods. 1984;10(3-4):203-209.
- Mahmood T, Yang PC. Western blot: technique, theory, and trouble shooting. N Am J Med Sci. 2012;4(9):429-434.
- Kurien BT, Scofield RH. Western blotting. Methods. 2006;38(4):283-293.
- Bradford MM. A rapid and sensitive method for the quantitation of microgram quantities of protein utilizing the principle of protein-dye binding. Anal Biochem. 1976;72:248-254.
- Smith PK, Krohn RI, Hermanson GT, et al. Measurement of protein using bicinchoninic acid. Anal Biochem. 1985;150(1):76-85.
- Taylor SC, Posch A. The design of a quantitative western blot experiment. Biomed Res Int. 2014;2014:361590.
- Taylor SC, Berkelman T, Yadav G, Hammond M. A defined methodology for reliable quantification of Western blot data. Mol Biotechnol. 2013;55(3):217-226.
- Gilda JE, Gomes AV. Stain-Free total protein staining is a superior loading control to beta-actin for Western blots. Anal Biochem. 2013;440(2):186-188.
- Ghosh R, Gilda JE, Gomes AV. The necessity of and strategies for improving confidence in the accuracy of western blots. Expert Rev Proteomics. 2014;11(5):549-560.
- Janes KA. An analysis of critical factors for quantitative immunoblotting. Sci Signal. 2015;8(371):rs2.
- Pillai-Kastoori L, Schutz-Geschwender AR, Harford JA. A systematic approach to quantitative Western blot analysis. Anal Biochem. 2020;593:113608.
- Uhlen M, Bandrowski A, Carr S, et al. A proposal for validation of antibodies. Nat Methods. 2016;13(10):823-827.
- Salinovich O, Montelaro RC. Reversible staining and peptide mapping of proteins transferred to nitrocellulose after separation by sodium dodecylsulfate-polyacrylamide gel electrophoresis. Anal Biochem. 1986;156(2):341-347.
- Romero-Calvo I, Ocon B, Martinez-Moya P, et al. Reversible Ponceau staining as a loading control alternative to actin in Western blots. Anal Biochem. 2010;401(2):318-320.
- Johnson DA, Gautsch JW, Sportsman JR, Elder JH. Improved technique utilizing nonfat dry milk for analysis of proteins and nucleic acids transferred to nitrocellulose. Gene Anal Tech. 1984;1(1):3-8.
- Bass JJ, Wilkinson DJ, Rankin D, et al. An overview of technical considerations for Western blotting applications to physiological research. Scand J Med Sci Sports. 2017;27(1):4-25.
- Weber K, Osborn M. The reliability of molecular weight determinations by dodecyl sulfate-polyacrylamide gel electrophoresis. J Biol Chem. 1969;244(16):4406-4412.
- Eaton SL, Roche SL, Llavero Hurtado M, et al. Total protein analysis as a reliable loading control for quantitative fluorescent Western blotting. PLoS One. 2013;8(8):e72457.
- Bolt MW, Mahoney PA. High-efficiency blotting of proteins of diverse sizes following sodium dodecyl sulfate-polyacrylamide gel electrophoresis. Anal Biochem. 1997;247(2):185-192.
- Ornstein L. Disc electrophoresis I: background and theory. Ann N Y Acad Sci. 1964;121(2):321-349.
- Davis BJ. Disc electrophoresis II: method and application to human serum proteins. Ann N Y Acad Sci. 1964;121(2):404-427.
- Chrambach A, Rodbard D. Polyacrylamide gel electrophoresis. Science. 1971;172(3982):440-451.
- Gelfi C, Righetti PG. Polymerization kinetics of polyacrylamide gels. I. Effect of different cross-linkers. Electrophoresis. 1981;2(4):213-219.
- Caglio S, Righetti PG. On the pH dependence of polymerization efficiency, as investigated by capillary zone electrophoresis. Electrophoresis. 1993;14(1):997-1003.
- Menter P. Acrylamide polymerization: a practical approach. Bio-Rad Technical Note 1156.
- LoPachin RM. The changing view of acrylamide neurotoxicity. Neurotoxicology. 2004;25(4):617-630.